What Two Readers Can Agree On
A definition is only worth what two readers can independently reproduce. Classification of Atrophy Report 6 tested whether graders agree on the OCT signs of early atrophy, and the answer complicates the endpoint we just defined


In the last entry we settled on a definition. cRORA gives us a fixed endpoint: choroidal hypertransmission and RPE loss of at least 250 microns, with overlying photoreceptor degeneration. But a definition and the ability to apply it are two different things. Show the same B-scan to two trained readers and the real question is whether they call it the same way. When they do not, the definition is pointing at something the imaging cannot pin down the same way twice, and an endpoint that moves with whoever is reading it cannot anchor a trial.
Classification of Atrophy Report 6 put that question to the test. Twelve readers from six reading centres each graded the same 60 OCT B-scans, drawn from 60 eyes with AMD and weighted so that roughly a third showed cRORA, a third iRORA, and a third drusen without atrophy. Every reader worked from the same grading manual, after a formal training conference, and scored nine individual OCT features on each scan. This is closer to the reading room of a multicentre trial than to two colleagues comparing notes at the same screen, and that is deliberate. If readers cannot agree here, they will not agree anywhere the definition is actually used.
The authors reported agreement with Gwet's first-order coefficient rather than the more familiar kappa. The reason matters for how we read the numbers. Kappa is distorted by how common a feature is: when a sign appears in almost every scan, or almost none, kappa can collapse toward zero even while readers agree on nearly every case. Several atrophy features are either very common or quite rare in this set, so kappa would have understated real agreement. Gwet's coefficient is built to stay stable across those prevalence swings, so the values that follow reflect agreement rather than the base rate of each sign.
On that measure, most of the individual signs held up well. Seven of the nine qualitative features reached substantial or better agreement, from 0.63 for choroidal hypertransmission up to 0.87 for ellipsoid zone disruption, with external limiting membrane disruption, outer nuclear layer thinning, subsidence of the outer plexiform and inner nuclear layers, and the hyporeflective wedge-shaped band all falling in the same band (Figure 1). Read as a group, the OCT signature of early atrophy is something independent graders recognise fairly consistently.
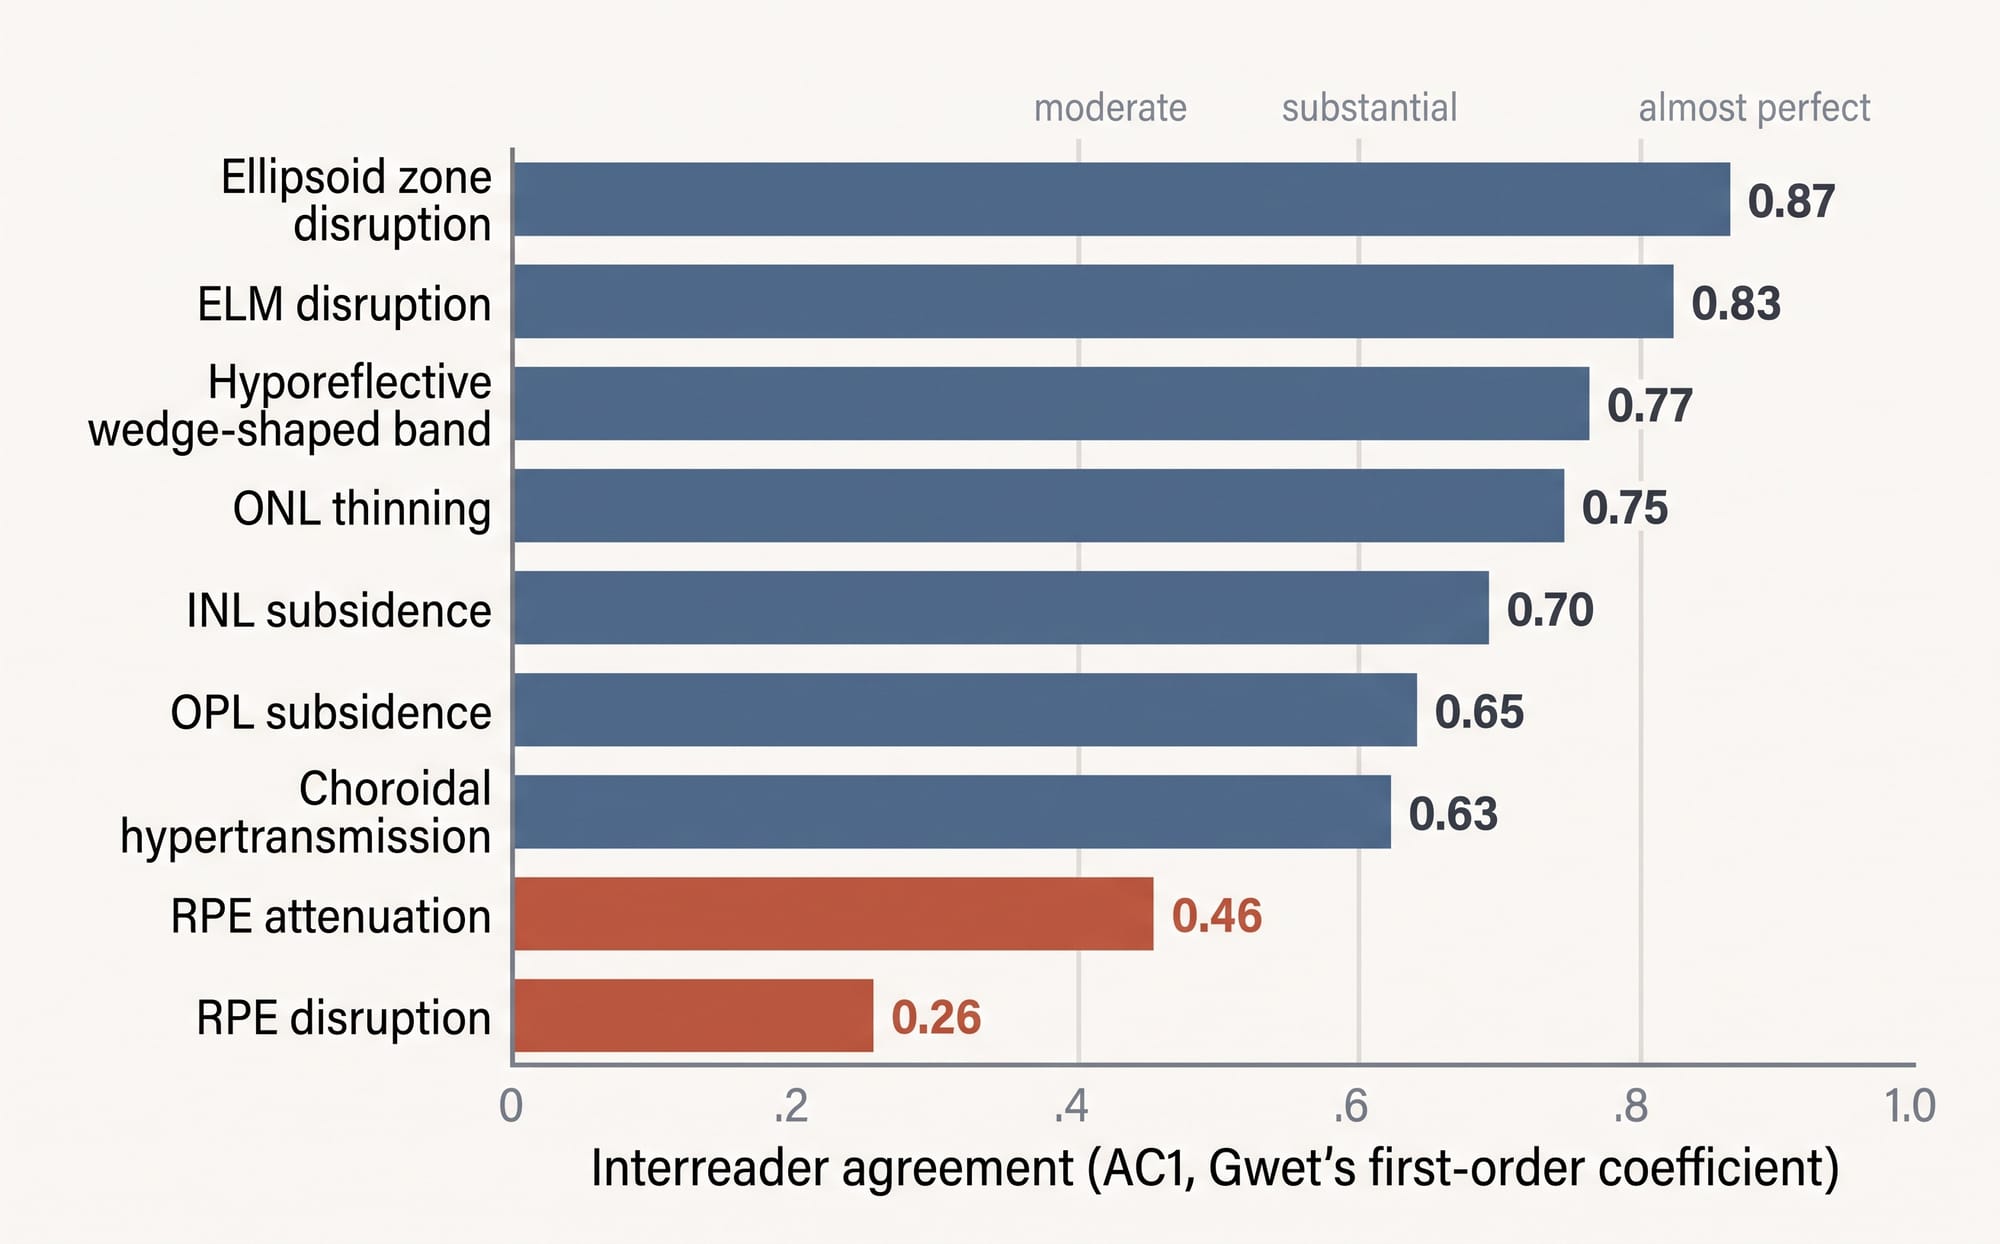
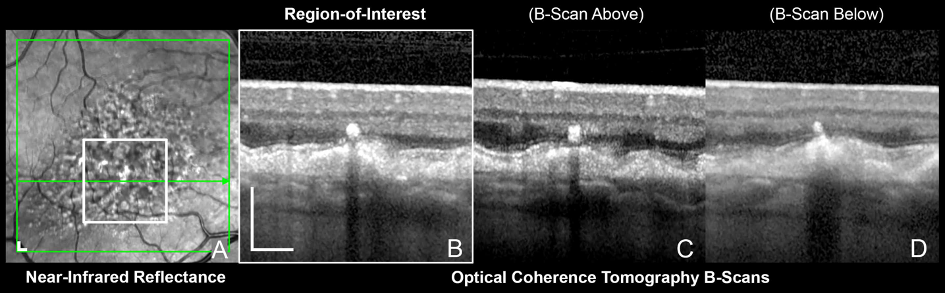
Two features broke the pattern, and they are the ones to worry about. The two features that give cRORA its "complete", RPE attenuation and RPE disruption, are the two that readers agreed on least, at 0.46 and 0.26. The edges of RPE loss are genuinely hard to call, a difficulty the readers themselves flagged during training and one the quantitative data confirmed, since the zone of RPE disruption carried the widest reader-to-reader spread of any horizontal measurement. In one representative scan, only six of the twelve readers marked RPE attenuation as present at all (Figure 2).
The awkward part is that this is the feature the endpoint is named after. And yet the composite call survives it. When readers classified whole scans, agreement on the presence of cRORA reached 0.68, above agreement on iRORA presence at 0.58. The endpoint holds together better than its weakest ingredient because the classification leans on signs that are easier to see, above all the choroidal hypertransmission that sits underneath it.
The study does not stop at the problem. If agreement rides on the clearer signs, a definition built around them should be more reproducible than one built around the RPE edge, and the authors tested exactly that. When the earlier grade was rebuilt around the signs readers agree on, subsidence and the hyporeflective wedge together with choroidal hypertransmission, three-category agreement rose from 0.53 to 0.68. Hypertransmission earns its place here: among the quantitative measures it was the most repeatable by a wide margin, with readers landing within roughly 190 microns of one another, and its agreement did not decay as lesions grew smaller. A staging system built on what two readers can both measure will be more trustworthy than one resting on what a single expert can name.
None of this tells us which of these early lesions will actually progress. Reproducibility is only the precondition here. A sign we can agree on is worth measuring only if it predicts where the disease is going. iRORA is the natural place to ask that, because it names the stage before the endpoint, and the next entry takes it up directly. For now the more immediate question is the one this study leaves on the table. If the feature that defines our endpoint is also the feature we agree on least, how much of what we call progression is the lesion changing, and how much is the reader?
References:
- Wu Z, Pfau M, Blodi BA, et al. OCT Signs of Early Atrophy in Age-Related Macular Degeneration: Interreader Agreement. Classification of Atrophy Meetings Report 6. Ophthalmology Retina. 2022;6(1):4-14.
- Sadda SR, Guymer R, Holz FG, et al. Consensus Definition for Atrophy Associated with Age-Related Macular Degeneration on OCT: Classification of Atrophy Report 3. Ophthalmology. 2018;125(4):537-548. (cited for the cRORA definition carried over from Entry 1)